Scope 3 Emissions

Complete Value Chain Visibility & Control

Summary

Scope 3 emissions, also known as value chain emissions, are all indirect emissions that occur in the reporting company's upstream and downstream supply chain.

End-to-End Supply Chain Visibility

Gain unprecedented transparency across your entire value chain. Our advanced supplier data visualization provides multi-tier insights, allowing you to track emissions from raw material sourcing through manufacturing, distribution, and end-of-life.

  • Multi-Level Supplier Mapping: Visualize emissions across all tiers of your supply chain with interactive hierarchical views
  • Real-Time Data Integration: Connect directly with supplier data to track emissions as they occur throughout your value chain
  • Hotspot Identification: Quickly identify emission-intensive suppliers and categories to prioritize reduction efforts
  • Trend Analysis: Monitor emission changes over time and measure the impact of supplier engagement initiatives
🌐 Your Value Chain Visualization
Supply Chain Visualization
Key

"Scope 3 emissions may account for up to 90% of a company's total carbon footprint." They arise across the full value chain — from suppliers, logistics, product use, and disposal.

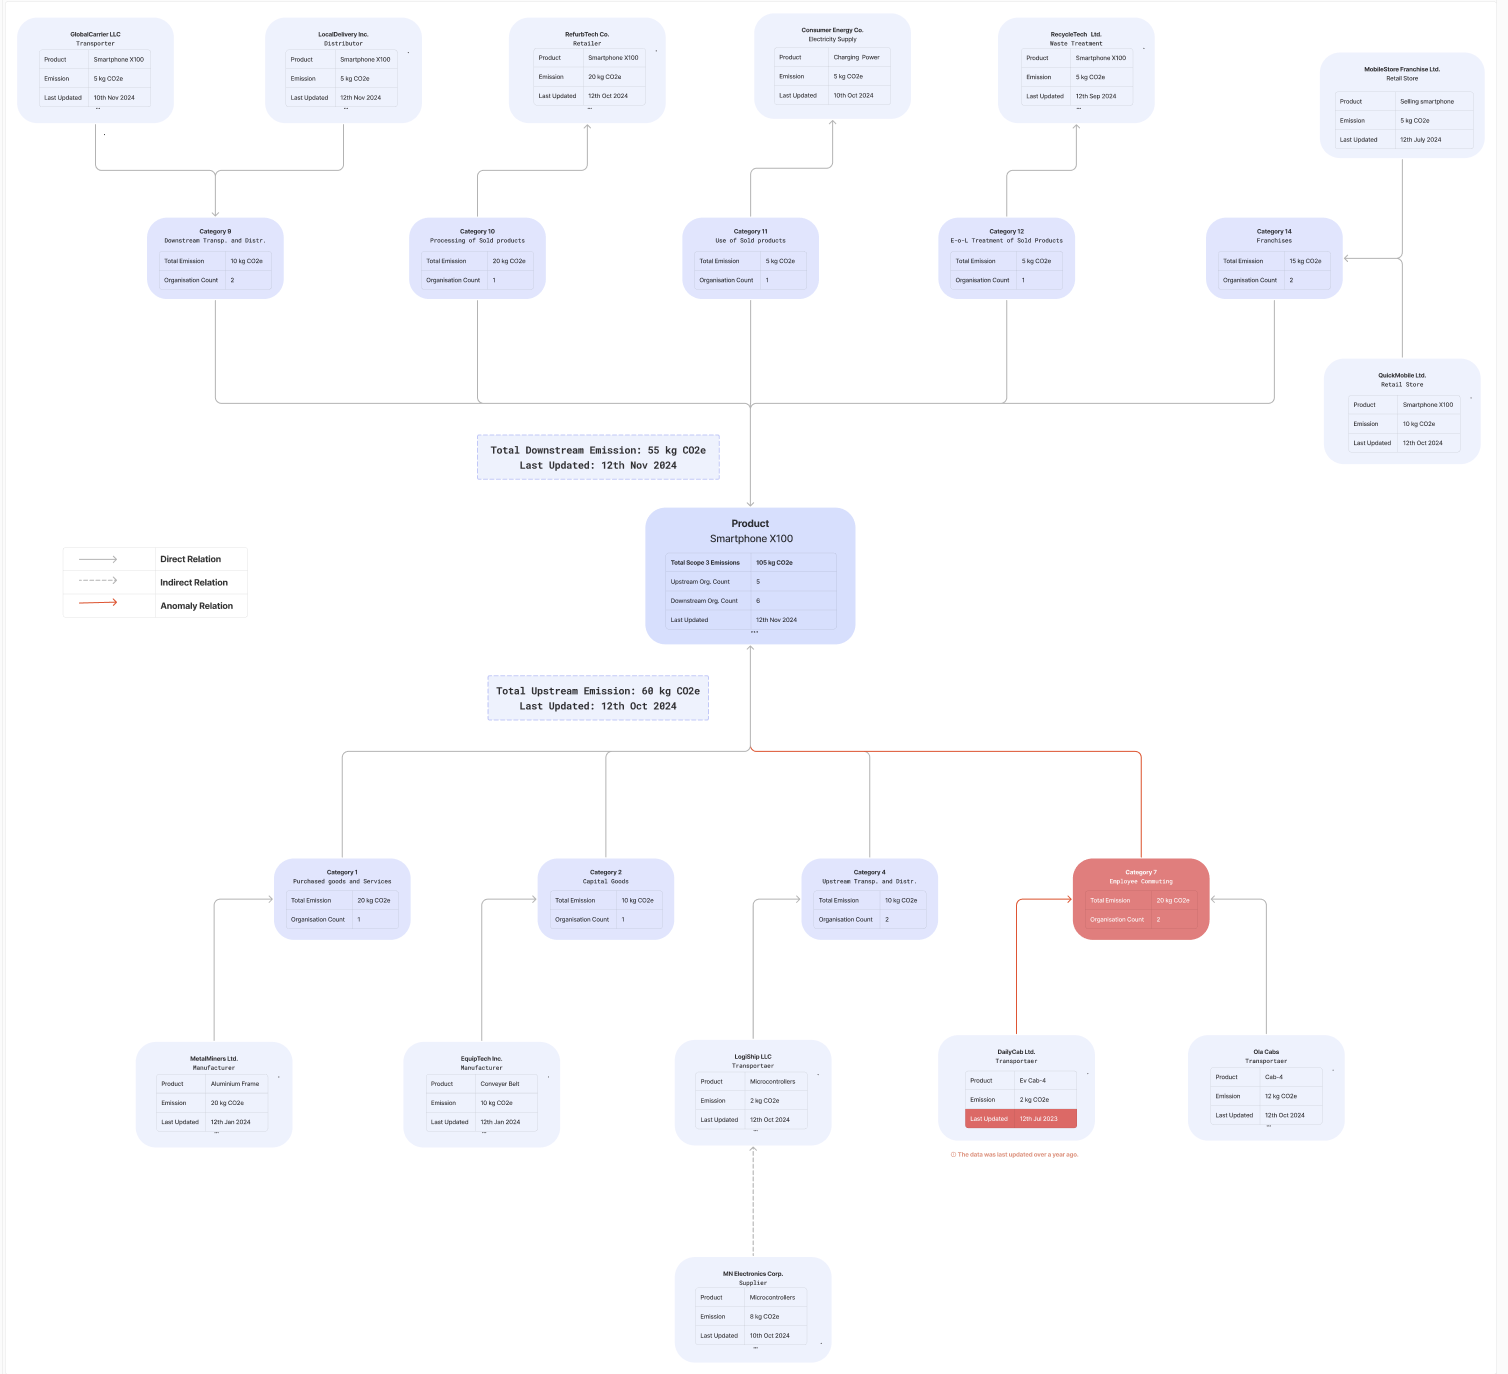
What Are Scope 3 Emissions?

Scope 3 covers all indirect emissions beyond your own operations and energy use. These include upstream Activities occurring before your operations, such as raw material extraction, component manufacturing, and transportation to your facilities. activities (like raw materials, manufacturing, transport) and downstream Refers to indirect emissions that occur after a company’s products leave its control — essentially, emissions generated during the use, distribution, and end-of-life of sold products or services. (product use, disposal, customer services).

Why They Matter

Many assessments estimate Scope 3 emissions can be 11.4× greater than a company's operational emissions. Science Based Targets Initiative

Because they span many actors and tiers of supply chains, collecting accurate data is complex and often fragmented. MIT Sloan

Without transparency in supplier emissions data Actual emission measurements from your suppliers' operations, essential for accurate Scope 3 accounting. , many companies rely on approximations Estimates based on industry averages or emission factors, which may not reflect actual supplier performance. , which can misrepresent true carbon impact. Nature

Scope 1+2 vs Scope 3 Emissions

Scope 1+2 (Operational) Baseline: 100%
100
Scope 3 (Value Chain) 1,140%
1,140
11.4× more

For most companies, value chain emissions dwarf direct operational emissions

Economic & Risk Implications

Supply chain emissions represent potential financial risk: suppliers project US$1.26 trillion in losses over the next five years unless decarbonization advances.

If these losses are passed to buyers, corporate expense could rise by ~US$120 billion.

As Scope 3 disclosure becomes more regulated and expected by investors, incomplete accounting exposes reputational, regulatory, and compliance risk.

Solutions & Action Levers

Supplier engagement Actively working with suppliers to understand, measure, and reduce their emissions through collaboration and partnership. & data sharing: Encourage or require suppliers to track and report emissions.

Capacity building: Provide training, tools, and incentives to suppliers to adopt cleaner processes.

Preferential procurement: Favor suppliers with low-carbon credentials.

Collective action / consortiums: Collaborate with peers to push standards and cost sharing.

Use of emission-factor databases and primary data where possible (vs approximations Using industry averages instead of actual supplier data, which reduces accuracy but is sometimes necessary when primary data is unavailable. ).

Scope 3 Emissions: Upstream & Downstream

15 categories define your full value-chain emissions

Upstream Categories (1-8)
Downstream Categories (9-15)
📦 Raw Materials → 🏭 Your Operations
1
🛒
Purchased Goods & Services
Emissions from producing the raw materials, components, supplies you buy.
Example: Steel, plastic components, office supplies
Click to expand →
2
🏗️
Capital Goods
Emissions associated with manufacturing equipment, infrastructure investments, etc.
Example: Machinery, buildings, vehicles, IT equipment
Click to expand →
3
Fuel & Energy-Related Activities
Emissions from upstream fuel production, fuel transport, energy losses, etc. (not in Scope 1 or 2).
Example: Extraction and refining of purchased fuels
Click to expand →
4
🚚
Upstream Transportation & Distribution
Moving materials from suppliers to your facilities (by road, rail, sea, air).
Example: Shipping raw materials to your factory
Click to expand →
5
🗑️
Waste Generated in Operations
Emissions from disposing or treating waste from your operations (before product leaves your site).
Example: Landfill disposal, wastewater treatment
Click to expand →
6
✈️
Business Travel
Emissions from flights, accommodations, transport when staff travel for work.
Example: Employee flights, hotel stays, rental cars
Click to expand →
7
🚗
Employee Commuting
Emissions from employees traveling between home and workplace.
Example: Daily commutes by car, bus, train
Click to expand →
8
🏢
Upstream Leased Assets
Emissions from assets you lease (e.g. office buildings, vehicles) that are upstream of your operations.
Example: Leased office space, leased vehicles
Click to expand →
📦 Your Products → 🏠 Use → ♻️ End of Life
9
🚛
Downstream Transportation & Distribution
Moving your finished products to customers, retailers, end points.
Example: Delivery to retail stores, customer shipping
Click to expand →
10
⚙️
Processing of Sold Products
If your product is an intermediate good that gets processed further by others.
Example: Fabric processed into garments
Click to expand →
11
💡
Use of Sold Products
Emissions from customers using your products (electricity consumption, fuel use, etc.).
Example: Electricity for appliances, fuel for vehicles
Click to expand →
12
♻️
End-of-Life Treatment
Emissions from disposal, recycling, or treatment of your products once used.
Example: Landfill, recycling facilities, incineration
Click to expand →
13
🏪
Downstream Leased Assets
Emissions from leased assets after you've sold them (e.g. leased equipment used by customers).
Example: Equipment leased to customers
Click to expand →
14
🍔
Franchises
Emissions from franchise locations / operations.
Example: Franchise restaurant energy use
Click to expand →
15
💰
Investments
Emissions related to your investments (if you invest in other companies, etc.).
Example: Portfolio company emissions
Click to expand →

⚠️ Highest Impact Categories (Typically)

  • 1. Purchased Goods & Services
  • 2. Use of Sold Products
  • 3. Upstream Transportation & Distribution

💡 Key Tips

✓ Not all 15 categories will apply to every business — assess relevance first
✓ Focus on categories with the largest emissions impact
✓ Use supplier data where possible; otherwise use emission factor approximations
Which of these categories apply to your business?

To understand and manage value-chain emissions, companies rely on the GHG Protocol Corporate Value Chain (Scope 3) Standard.

Reducing Scope 3 emissions isn't optional — it's essential for trust, resilience, and growth.

The GHG Protocol Scope 3 Standard

The GHG Protocol Scope 3 Standard provides a globally accepted framework for companies to measure, collect data, compute, and report value-chain (Scope 3) emissions.

Data Collection & Boundary Setting: Define clear boundaries and gather accurate value chain data
Calculation Methodologies: Apply standardized methods for consistent emissions quantification
Reporting & Transparency: Ensure credible, consistent disclosure to stakeholders

By adopting the standard, businesses can move beyond surface-level estimations and build robust portfolios of value-chain emission data, enabling more strategic climate action.

Download the Standard →

Why Reduce Scope 3 Emissions?

Reducing Scope 3 emissions delivers tangible value beyond climate benefits.

Brand & Stakeholder Trust
Stakeholders, investors, and customers increasingly expect companies to take responsibility for their full climate impact
Supply Chain Risk Mitigation
Climate, regulatory, and resource risks in supplier networks can affect your operations and cost base
Innovation & Growth Opportunities
Decarbonizing upstream and downstream can open new markets, product lines, and efficiency gains
Corporate Stewardship
Demonstrating action beyond internal operations signals true commitment to sustainability
💼 Companies that integrated supplier decarbonization saw significant cost savings and improved brand ratings across stakeholder groups

Start Mapping Your Scope 3 Emissions Today